PLS function performance assessment using Q2 indicator.
q2.PLS.RdThe q2.PLS function allows to assess PLS models using \(Q2\) criterion.
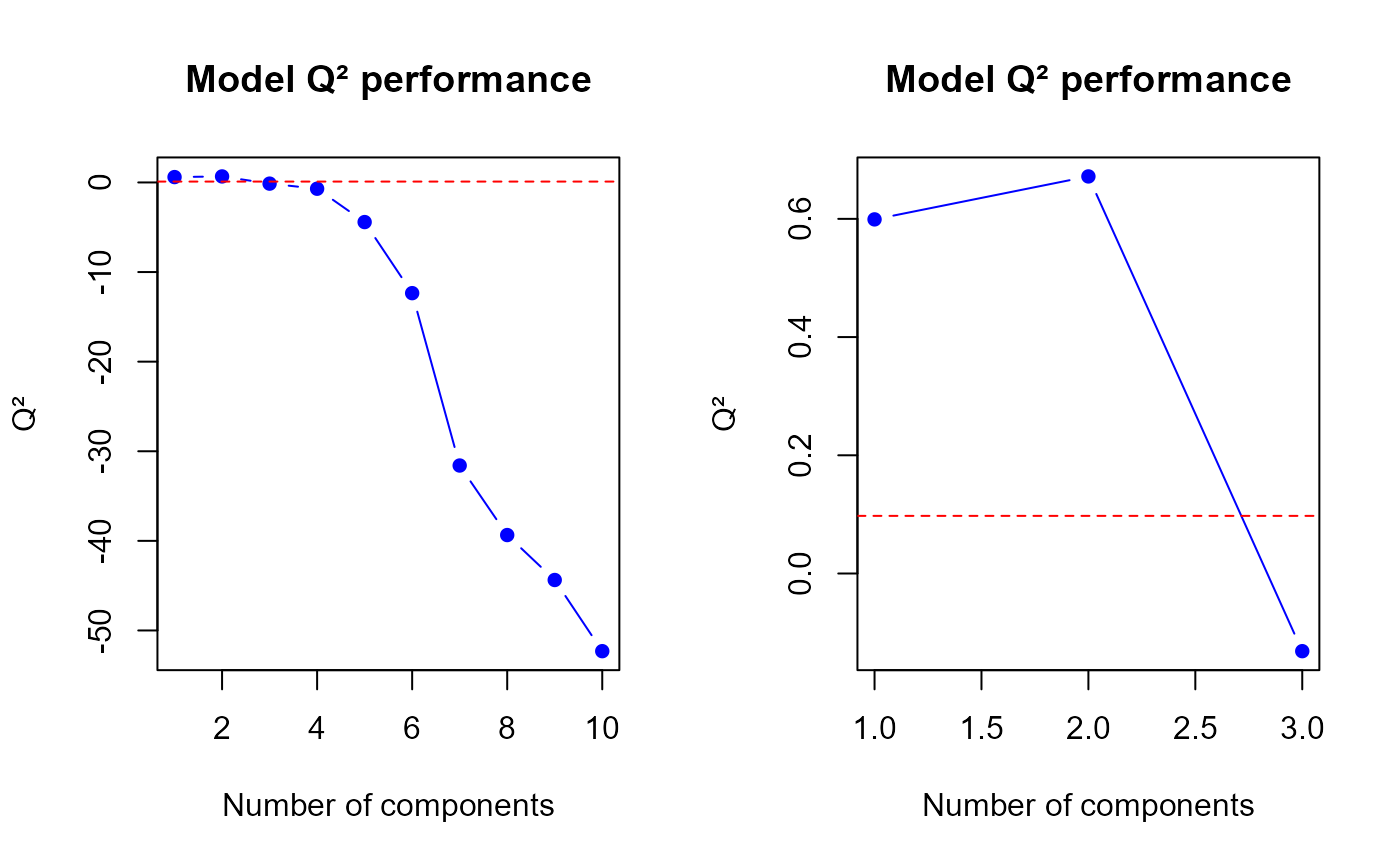
This function returns a list including \(Q2\) values for each number of components.
A plot allows to visualize the model performance according to the number of components.
Details
A suggestion about the number of components selection is also given by Q2 criterion. Endly, other indicators are given such as PRESS and RSS for each number of components and such as \(PRESSj\) and \(RSSj\) (matrices) for a given number of components and for a given column of Y dataset.
Value
\(PRESSj\) and \(RSSj\) are matrices of size \(ncomp\) x \(q\). The row sums of \(PRESSj\) and \(RSSj\) give respectively PRESS and RSS.
References
K.-A. Le Cao, Zoe Welham, Multivariate data integration using R (pages 172 to 174), MixOmics
Examples
library(sgPLSdevelop)

d <- data.create(n = 50, p = 10, q = 2, list = TRUE)
X <- d$X
Y <- d$Y

ncomp.max <- 10
model <- PLS(X = X, Y = Y, ncomp = ncomp.max, mode = "regression")

par(mfrow = c(1,2))
q2.res <- q2.PLS(model, ncomp = ncomp.max, mode = "regression")
h.best <- q2.res$h.best
q2.PLS(model, ncomp = min(h.best+1, ncomp.max))$q2

#> [1]  0.5991091  0.6717849 -0.1313998

# q2 values
q2.res$q2
#>  [1]   0.5991091   0.6717849  -0.1313998  -0.7011579  -4.4219535 -12.3546642
#>  [7] -31.5921060 -39.3521016 -44.3679320 -52.3112505

# PRESS values
q2.res$PRESS
#>  [1] 39.287310 10.888879  6.471984  5.736846  6.598945  7.143261  8.134252
#>  [8]  9.127399 10.128897 11.856188

# RSS values
#q2.res$RSS

# PRESS values by column
q2.res$PRESSj
#>              Y1        Y2
#>  [1,] 22.109356 17.177955
#>  [2,]  6.783288  4.105590
#>  [3,]  3.893774  2.578209
#>  [4,]  4.248296  1.488550
#>  [5,]  4.939311  1.659634
#>  [6,]  5.362923  1.780339
#>  [7,]  6.092753  2.041499
#>  [8,]  6.749920  2.377480
#>  [9,]  7.392741  2.736156
#> [10,]  8.587569  3.268619

# RSS values by column
#q2.res$RSSj
#> [1] 0.5991091 0.6717849 -0.1313998
# q2 values
q2.res$q2
#> [1] 0.5991091 0.6717849 -0.1313998 -0.7011579 -4.4219535 -12.3546642
#> [7] -31.5921060 -39.3521016 -44.3679320 -52.3112505
# PRESS values
q2.res$PRESS
#> [1] 39.287310 10.888879 6.471984 5.736846 6.598945 7.143261 8.134252
#> [8] 9.127399 10.128897 11.856188
# RSS values
#q2.res$RSS
# PRESS values by column
q2.res$PRESSj
#> Y1 Y2
#> [1,] 22.109356 17.177955
#> [2,] 6.783288 4.105590
#> [3,] 3.893774 2.578209
#> [4,] 4.248296 1.488550
#> [5,] 4.939311 1.659634
#> [6,] 5.362923 1.780339
#> [7,] 6.092753 2.041499
#> [8,] 6.749920 2.377480
#> [9,] 7.392741 2.736156
#> [10,] 8.587569 3.268619
# RSS values by column
#q2.res$RSSj